MagicMenu - AI Powered Smart Dining Assistant
Personal Project — AI & Flutter-based Smart Menu Assistant
2025.10 – 2025.11
When dining out, especially abroad, it's often hard to decide what to order just by looking at dish names. Language barriers and poor translations make it difficult to know ingredients or cooking methods.
To address this, I developed a Flutter-based mobile app. Its core function allows users to upload menu photos, which are analyzed by LLM APIs to generate a structured menu in the user's chosen language. This new menu includes photos, ingredients, cooking methods, allergens, and cultural background. The project demonstrates my full-stack capabilities in mobile development, AI integration, and complex data processing.
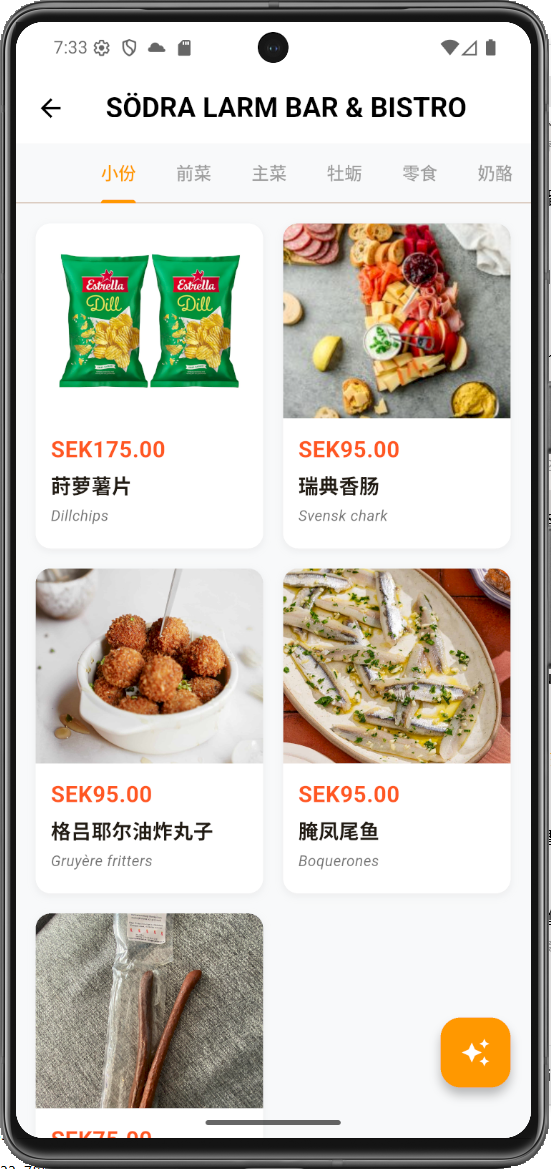
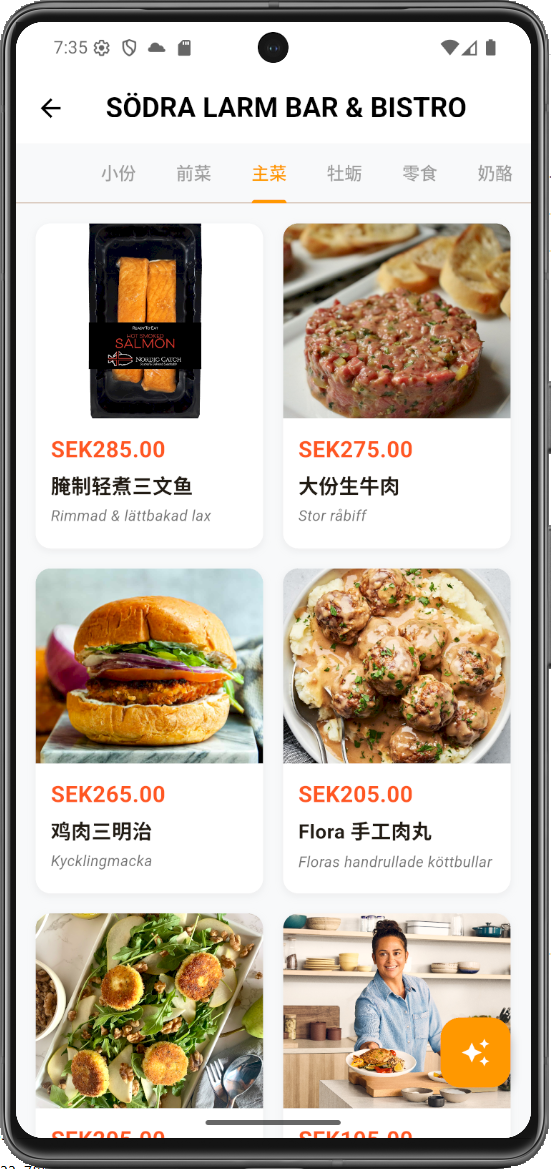
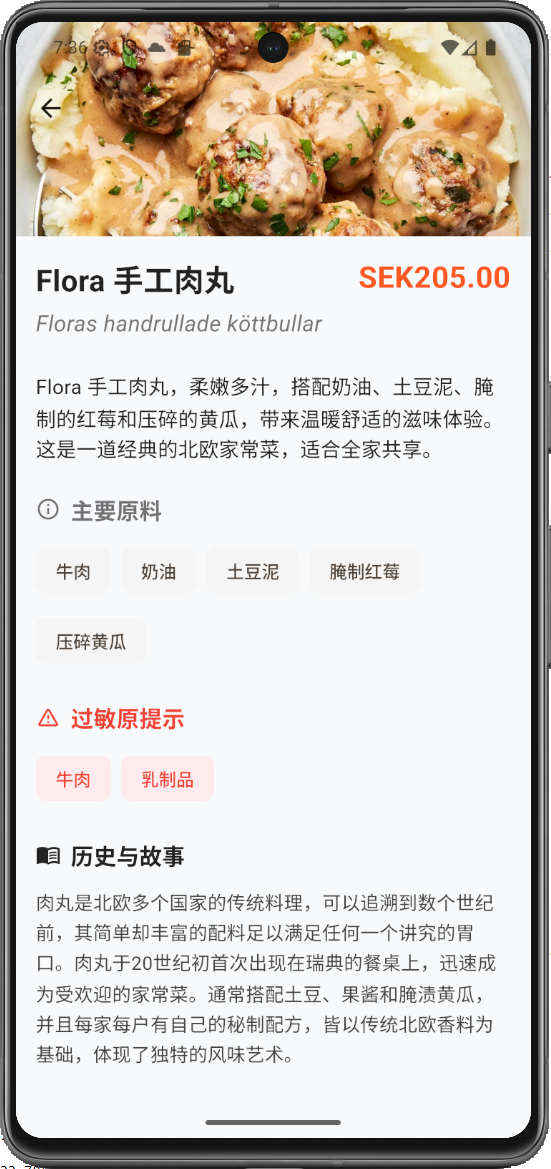
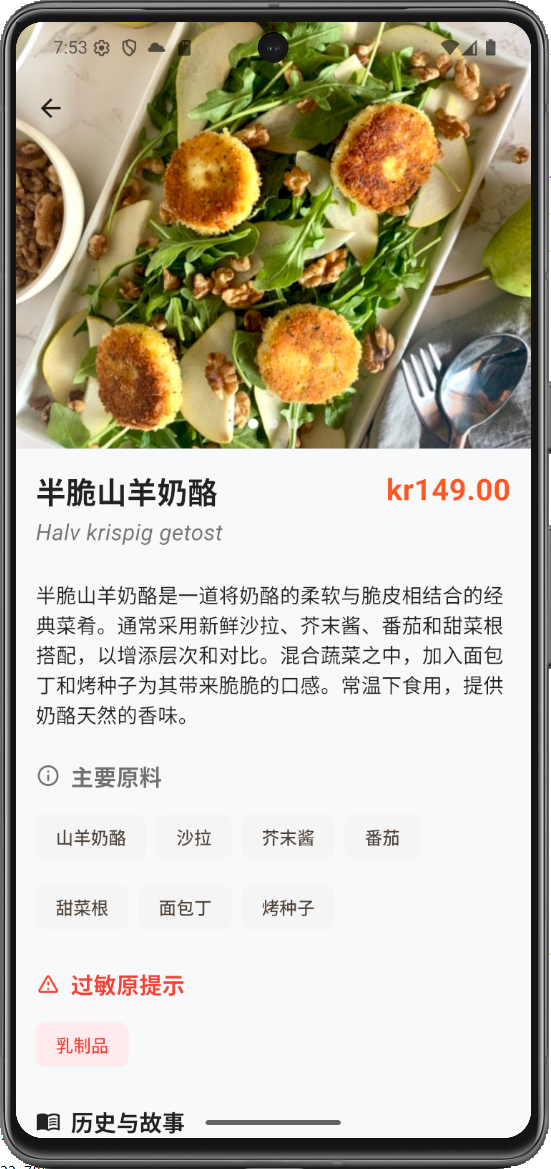
- 1. Intelligent Multi-Image Menu Analysis: Users can capture or upload multiple menu photos at once. Using asynchronous processing streams, unstructured images are converted into structured dish data—including names, recipes, ingredients, allergens, and cultural history—presented in a standardized format.
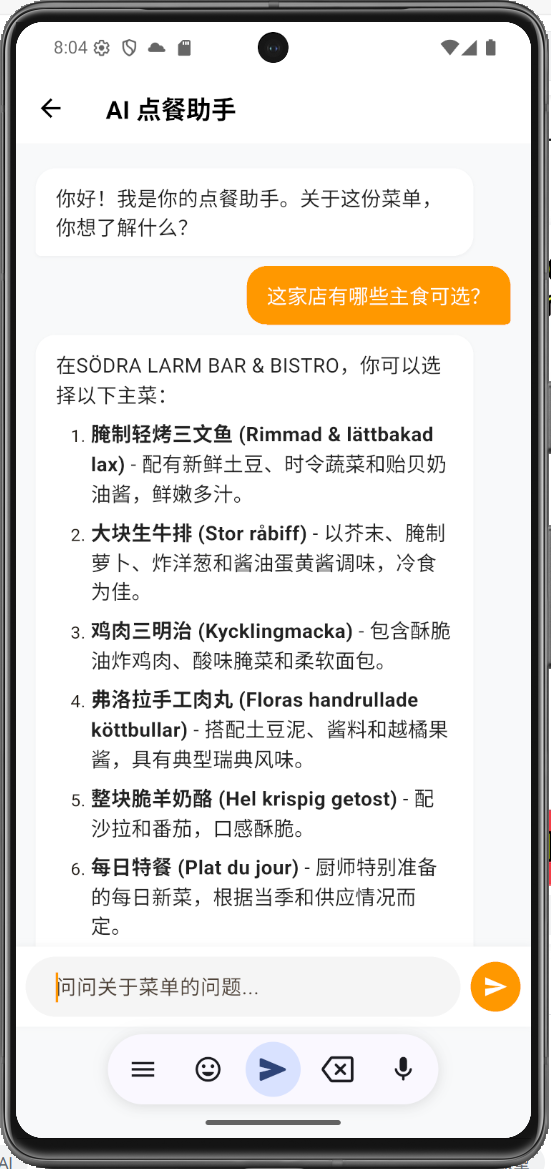
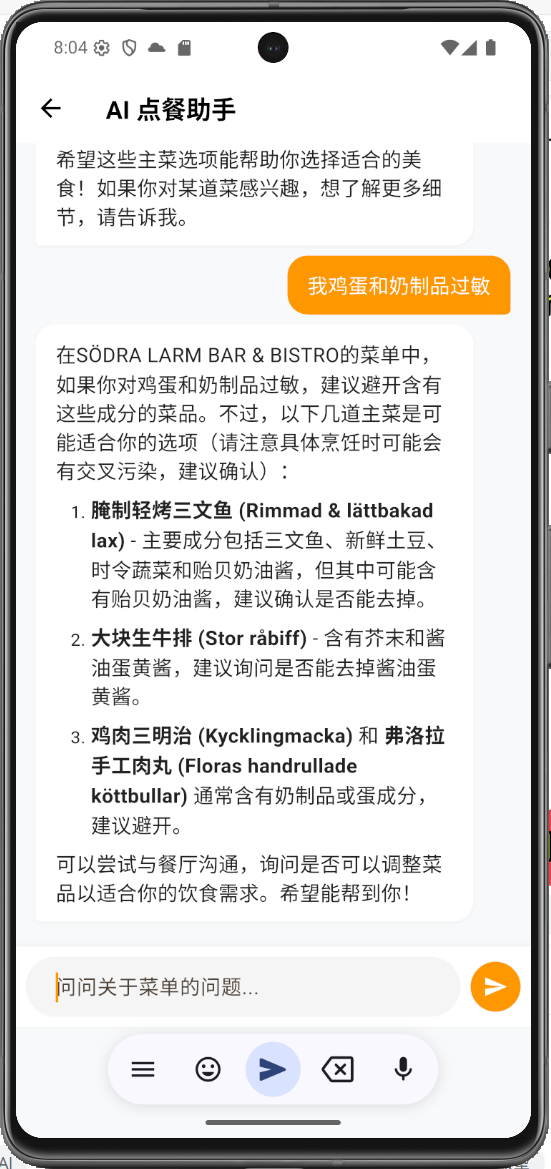
- 2. AI Ordering Assistant: An AI conversational assistant based on the current menu context. Users can ask questions like "Is this dish spicy?" or "Recommend a vegetarian option," and the AI responds based on the parsed menu data.
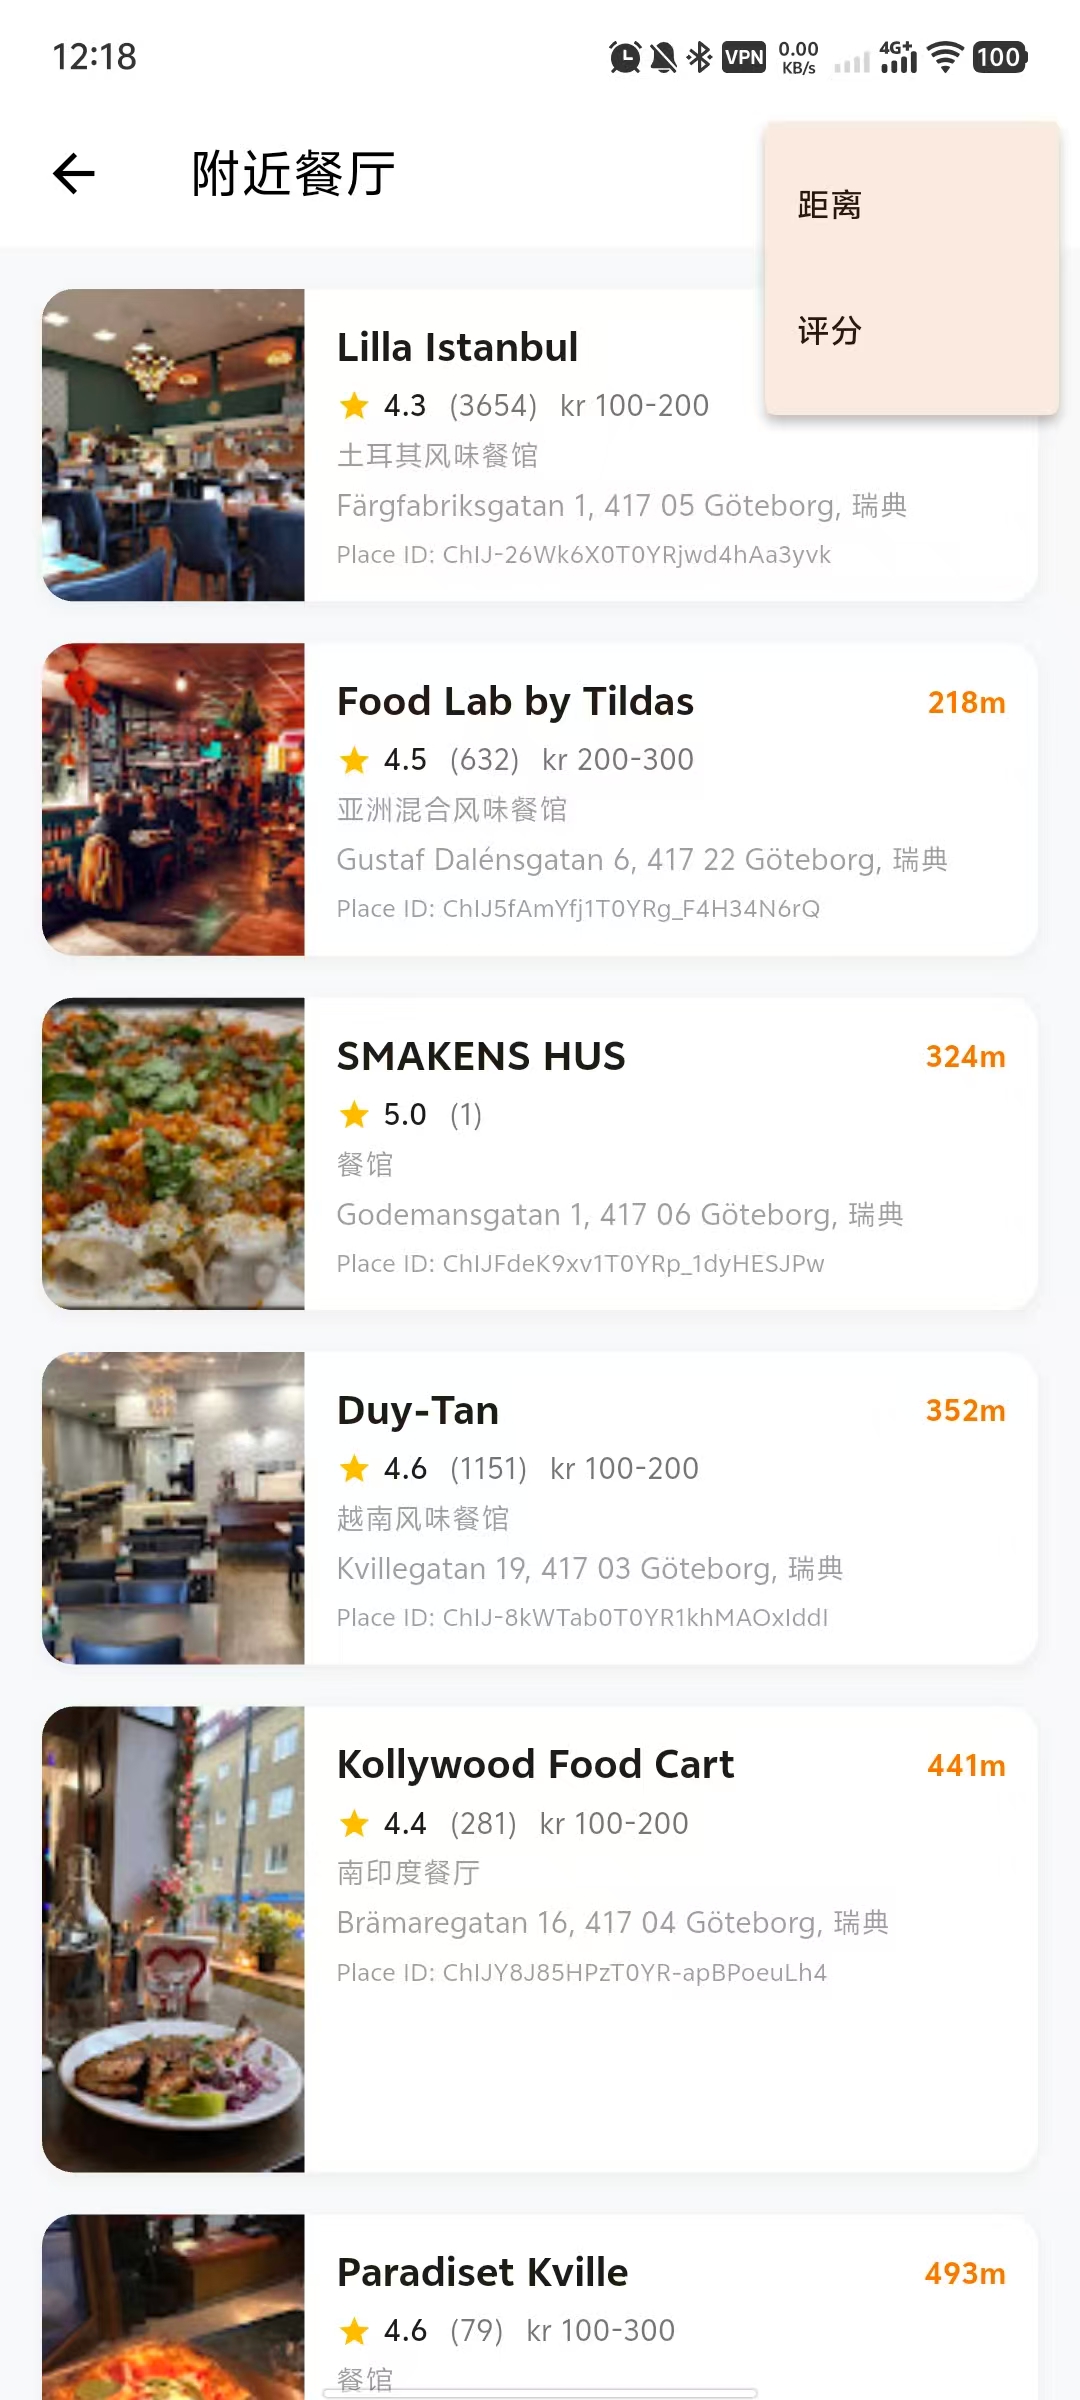
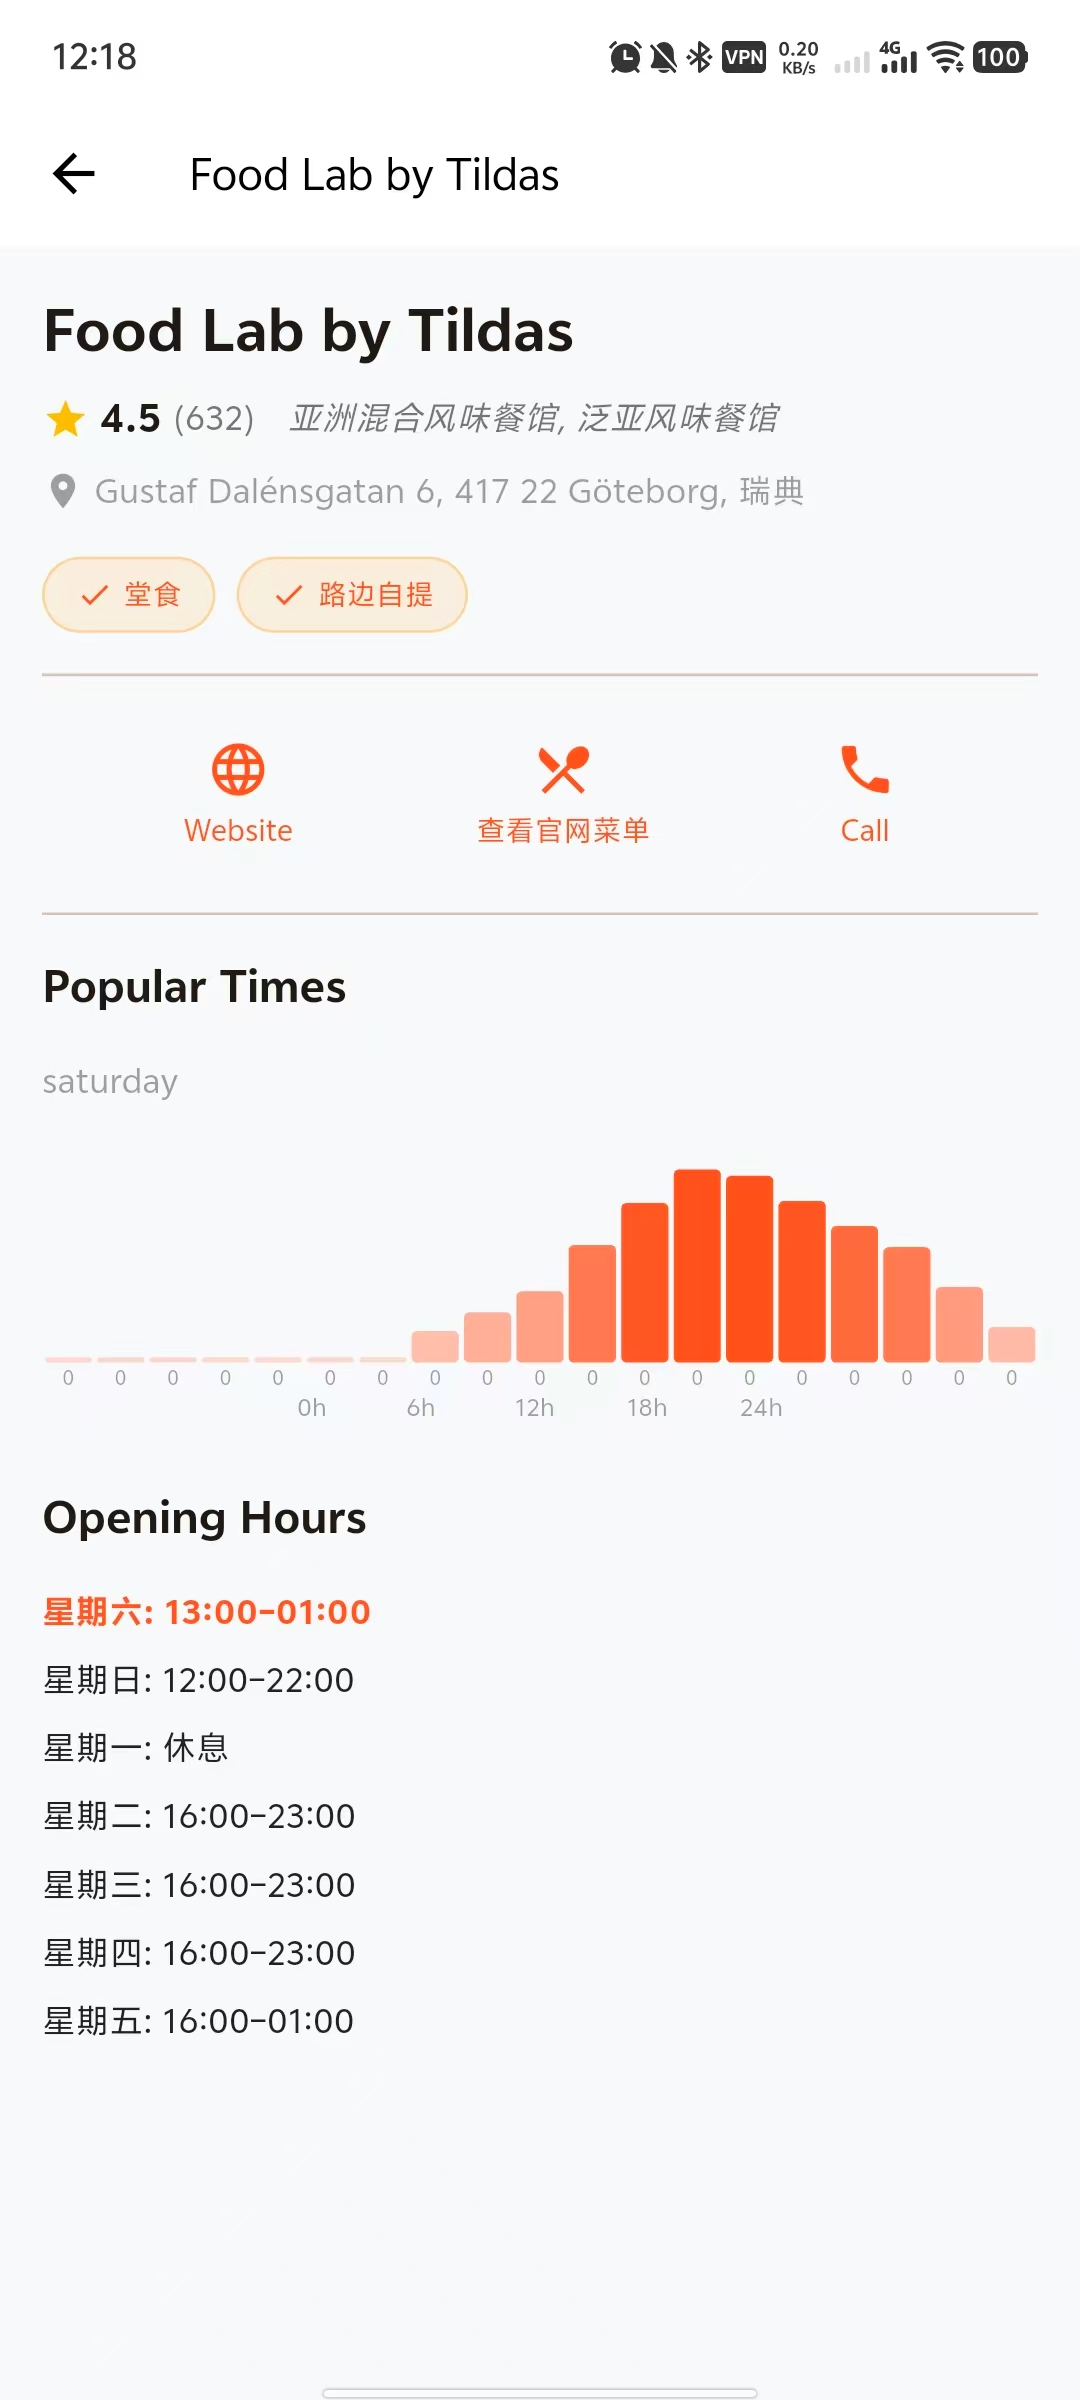
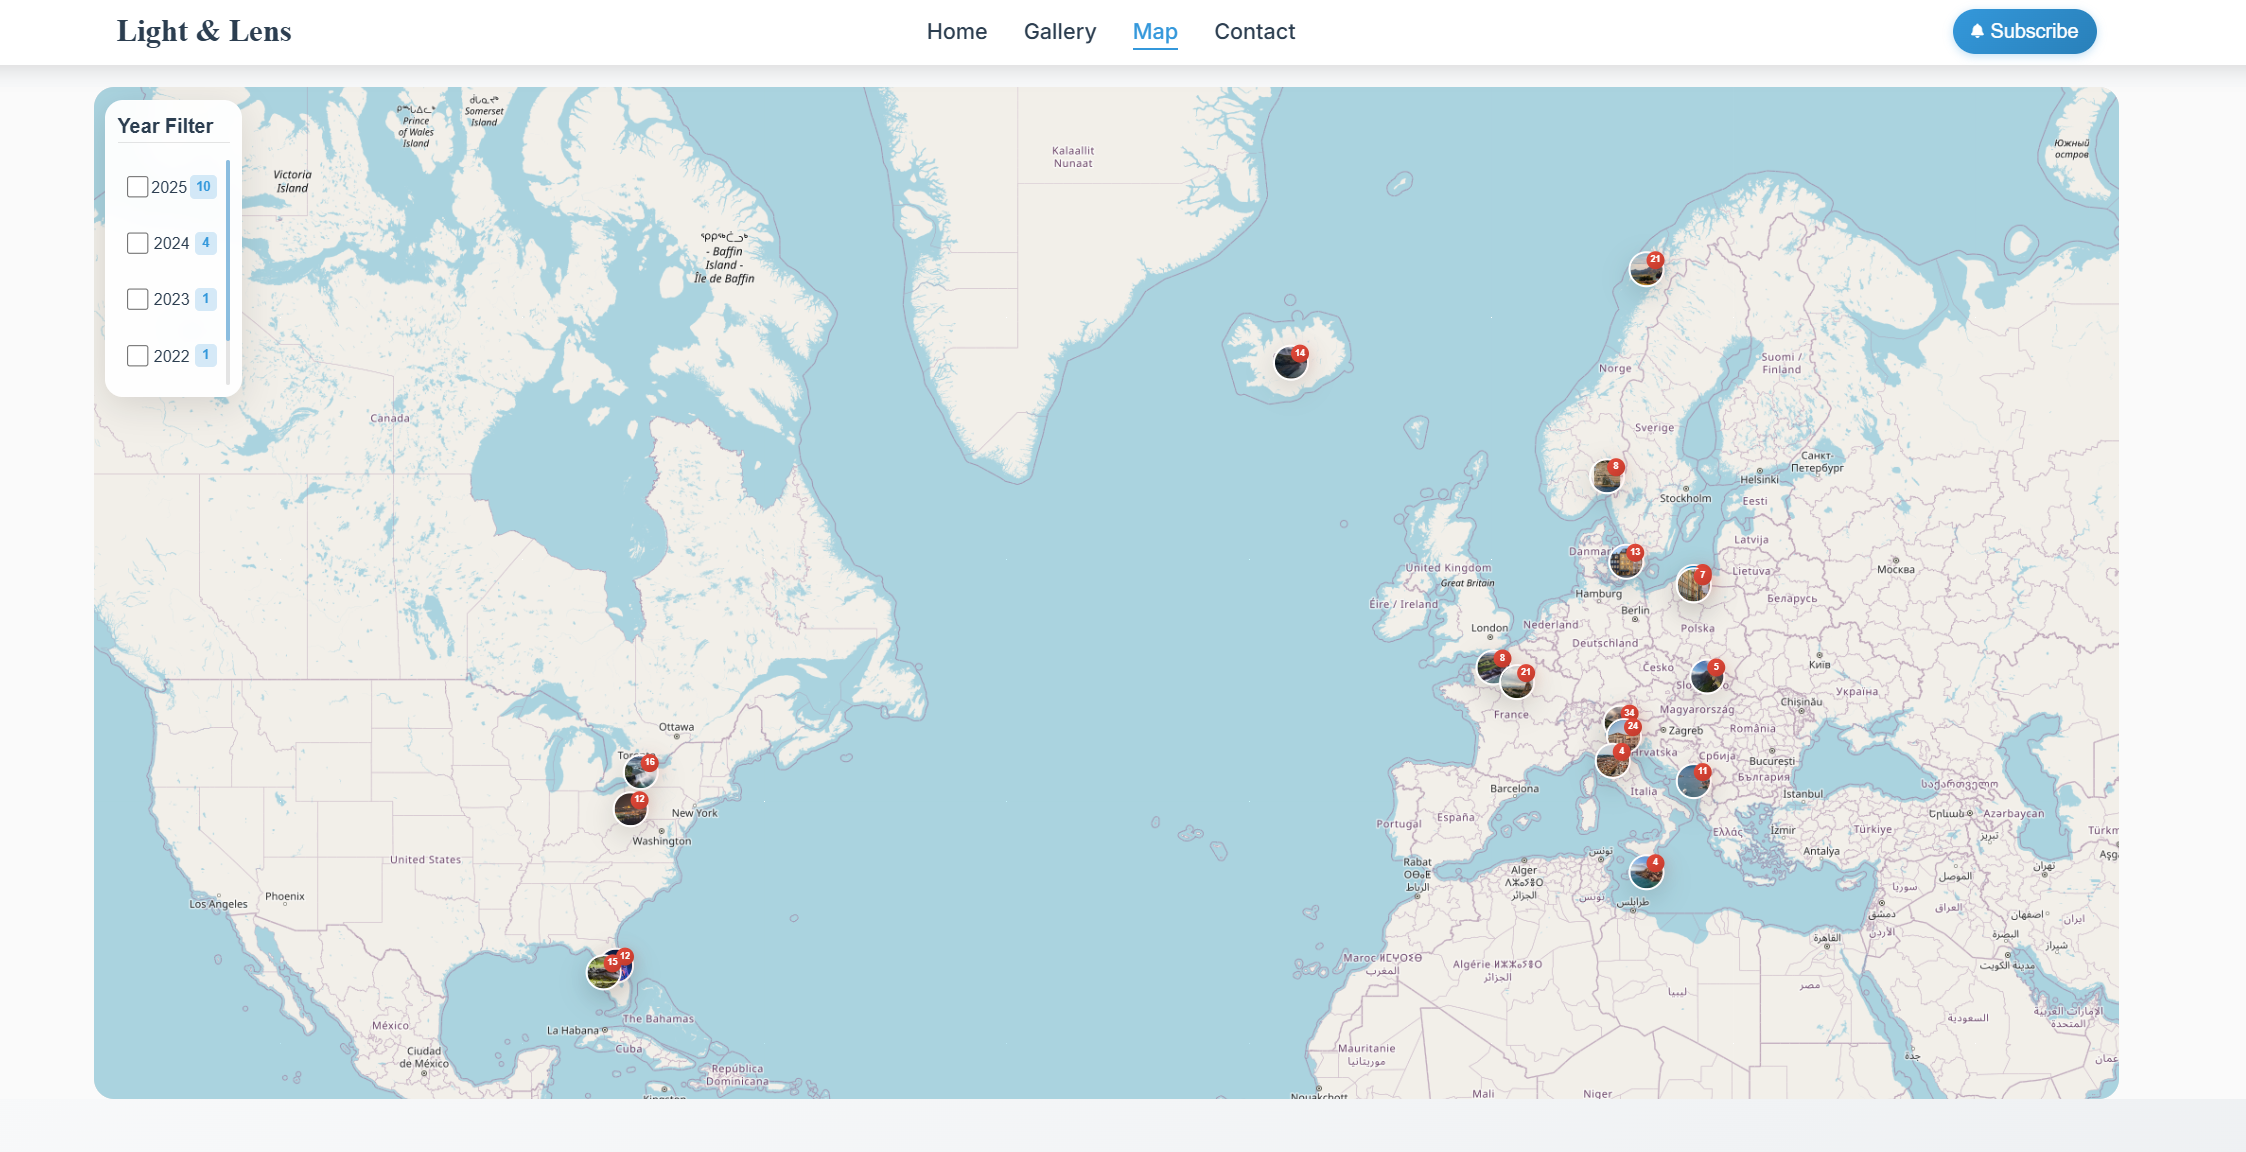
- 3. LBS Nearby Restaurant Explorer: Integrated geolocator to fetch real-time user location and dynamically display nearby restaurants. Implemented distance and rating-based sorting algorithms, and an interactive details page UI with image carousels, ratings, and service tags. It can also crawl restaurant websites to generate preset menus.
- Core Tech & AI Integration
1. Multi-Model AI Engine Integration: Encapsulated a generic LLM service layer supporting OpenAI (GPT-4o), Google Gemini, and Qwen. Designed System Prompts to force strict JSON output, ensuring frontend parsing stability.
2. SerpApi Search Capability: Utilized Google Maps Engine API to fetch real-time restaurant metadata (Place ID, hours, reviews) and search for dish images.
3. Local Caching: Adopted shared_preferences for user settings (API Keys, model selection) and JSON file system for history storage, achieving a backend-free architecture.
Flutter
Dart
LLM Integration
SerpApi
Google Maps API
Mobile Development